
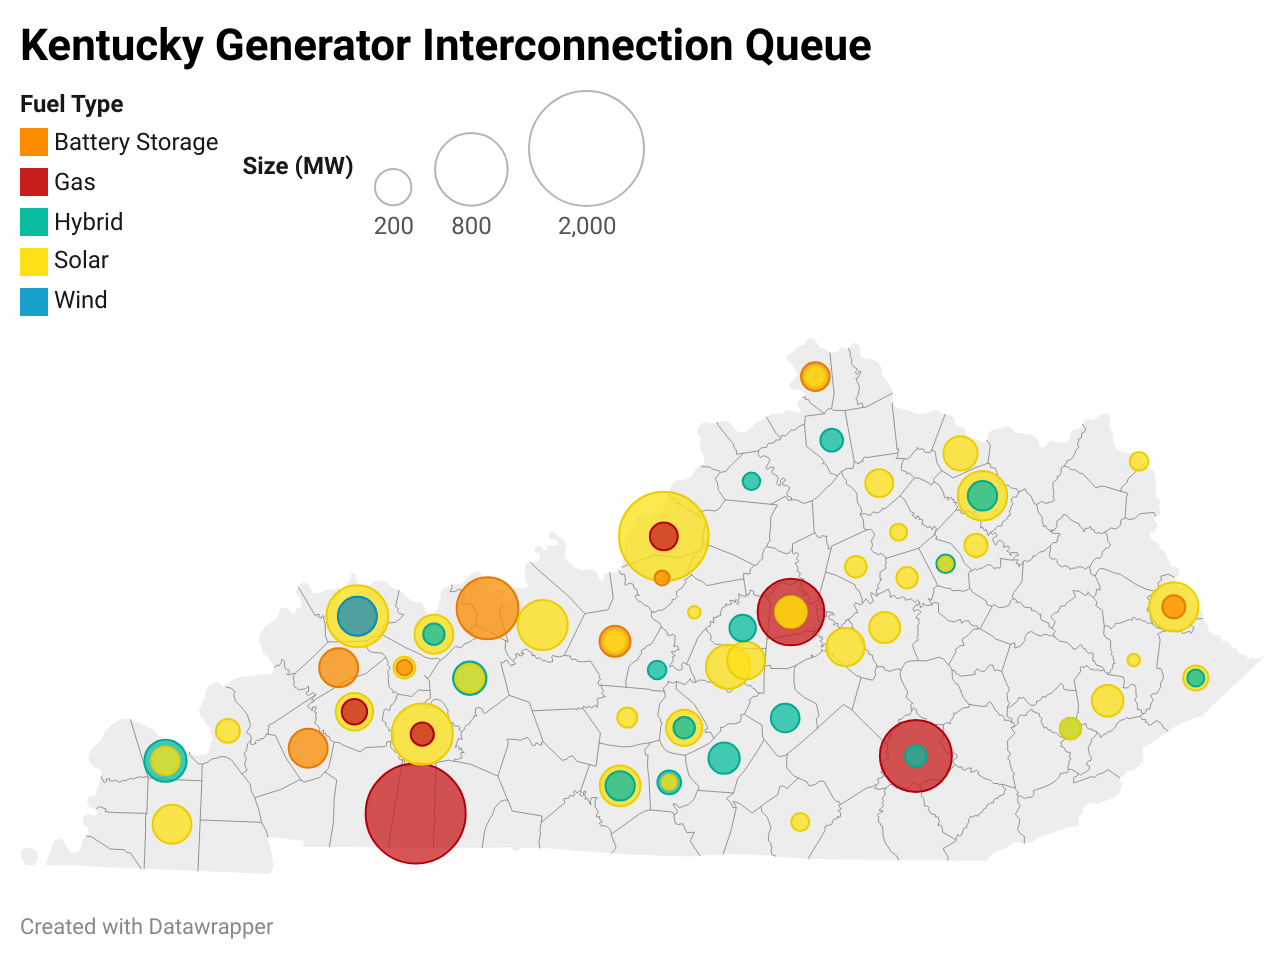
Kentucky stands out in the Southeast for its reliance on four different interconnection processes. PJM contributes the largest share of solar, while MISO carries smaller amounts of solar, wind, and hybrid. LGEKU filings reflect vertically integrated utility planning, while TVA adds both gas and solar. This distribution highlights Kentucky’s position at the crossroads of multiple transmission systems and regulatory frameworks. The state shows strong solar interest, moderate hybrid and storage activity, and more than 3 GW of gas capacity under study.
Kentucky by the Numbers
- Solar: 6.4 GW (1.5 GW in MISO, 3.9 GW in PJM, 0.4 GW in LGEKU, 0.6 GW in TVA)
- Wind: 0.2 GW (MISO only)
- Hybrid: 1.3 GW (0.2 GW in MISO, 0.9 GW in PJM, 0.2 GW in LGEKU)
- Battery Storage (Standalone): 1.6 GW (1.15 GW in MISO, 0.2 GW in PJM, 0.25 GW in LGEKU)
- Renewables Total: 9.6 GW
- Gas: 3.1 GW (0.8 GW in PJM, 0.8 GW in LGEKU, 1.6 GW in TVA)
Resource Mix
- Solar leads at 6.4 GW, most of it in PJM
- Hybrid projects add 1.3 GW, spread across MISO, PJM, and LGEKU
- Battery storage totals 1.6 GW, including merchant-led (MISO/PJM) and utility-led (LGEKU) activity
- Wind is minimal, with 0.2 GW in MISO
- Gas totals 3.1 GW, all outside MISO, concentrated in TVA, PJM, and LGEKU
Click here to view the full fall Southeastern Interconnection Queue report.
Interconnection Queue Data:
LGE&KU - http://www.oasis.oati.com/LGEE/index.html
MISO - https://www.misoenergy.org/planning/resource-utilization/GI_Queue/gi-interactive-queue/
PJM - https://www.pjm.com/planning/service-requests/serial-service-request-status